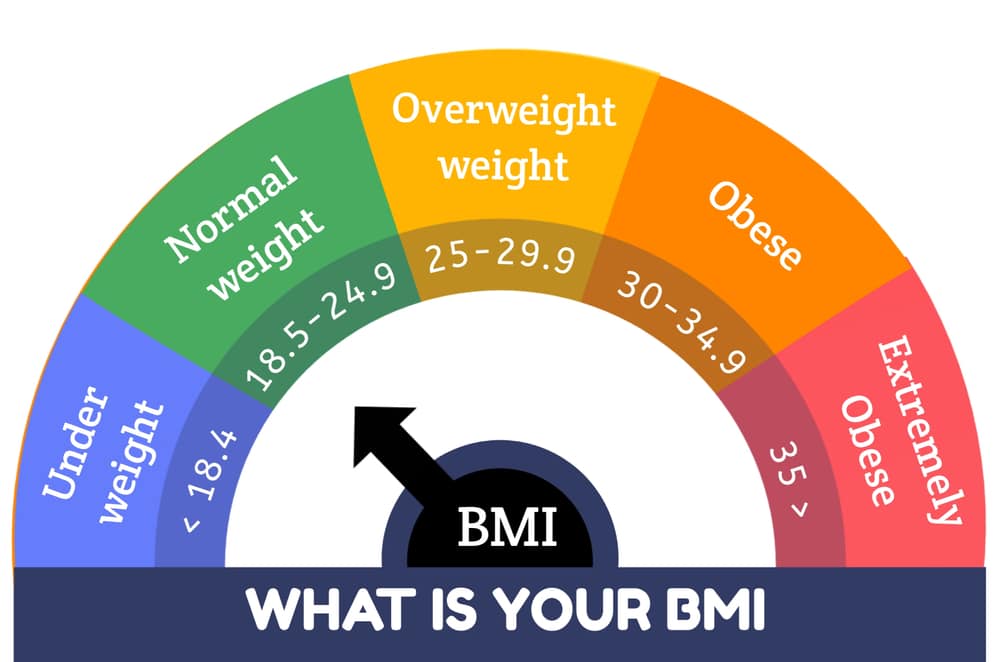
BMI Chart for Men, Women, and Children
A BMI chart provides a visual guide that helps individuals understand which category their weight falls into based on height and weight. The ranges differ slightly for children and teenagers, making charts useful for families tracking health progress.
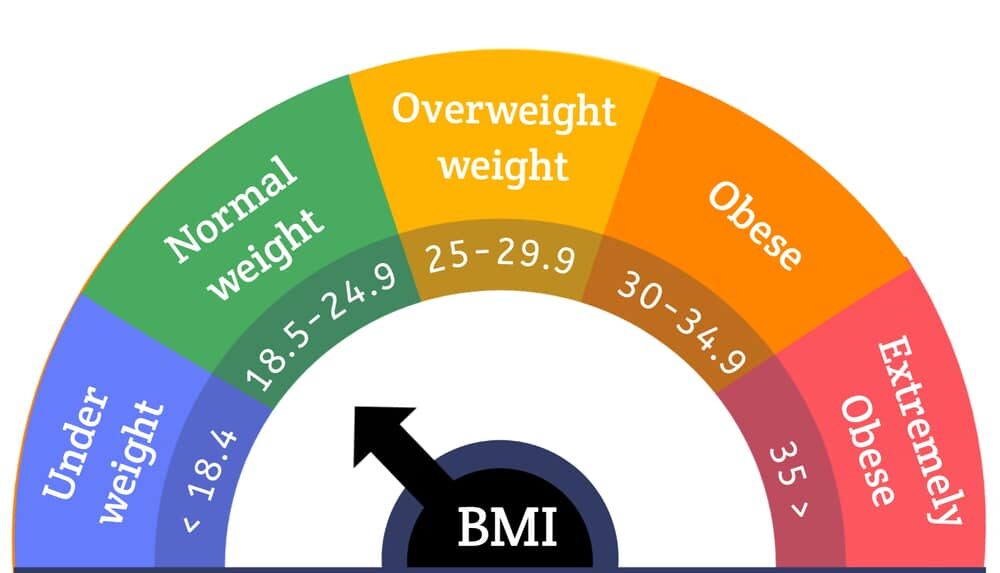
BMI Chart for Adults (Men & Women)
BMI ranges are the same for adult men and women:
- Below 18.5 → Underweight
- 18.5 – 24.9 → Healthy
- 25 – 29.9 → Overweight
- 30+ → Obese
Example Table
| Category | BMI Range |
|---|---|
| Underweight | < 18.5 |
| Healthy Weight | 18.5 – 24.9 |
| Overweight | 25 – 29.9 |
| Obese | 30+ |
BMI Chart for Children (Age-Adjusted)
Children’s BMI is assessed differently. Doctors compare children to age and sex percentile charts.
BMI percentile meanings:
- Below 5th percentile → Underweight
- 5th – 85th → Healthy
- 85th – 95th → Overweight
- 95th+ → Obese
Why BMI Charts Matter
- Easy to understand
- Useful for tracking weight changes
- Helps detect obesity early
- Promotes healthier lifestyle choices
Limitations
The BMI chart does not:
- Measure body fat accurately
- Consider genetics or muscle mass
Conclusion
BMI charts are simple tools that help individuals quickly determine whether their weight is within a healthy range. For precise health assessments, BMI should be combined with medical consultation and regular monitoring.
If you are not familiar with BMI, you can learn more in What is BMI and How is it Calculated?
To understand whether BMI alone is the best indicator of health, see our guide Is BMI Accurate?
If your BMI is above the healthy range, try our Healthy Ways to Reduce BMI Fast and Safely.